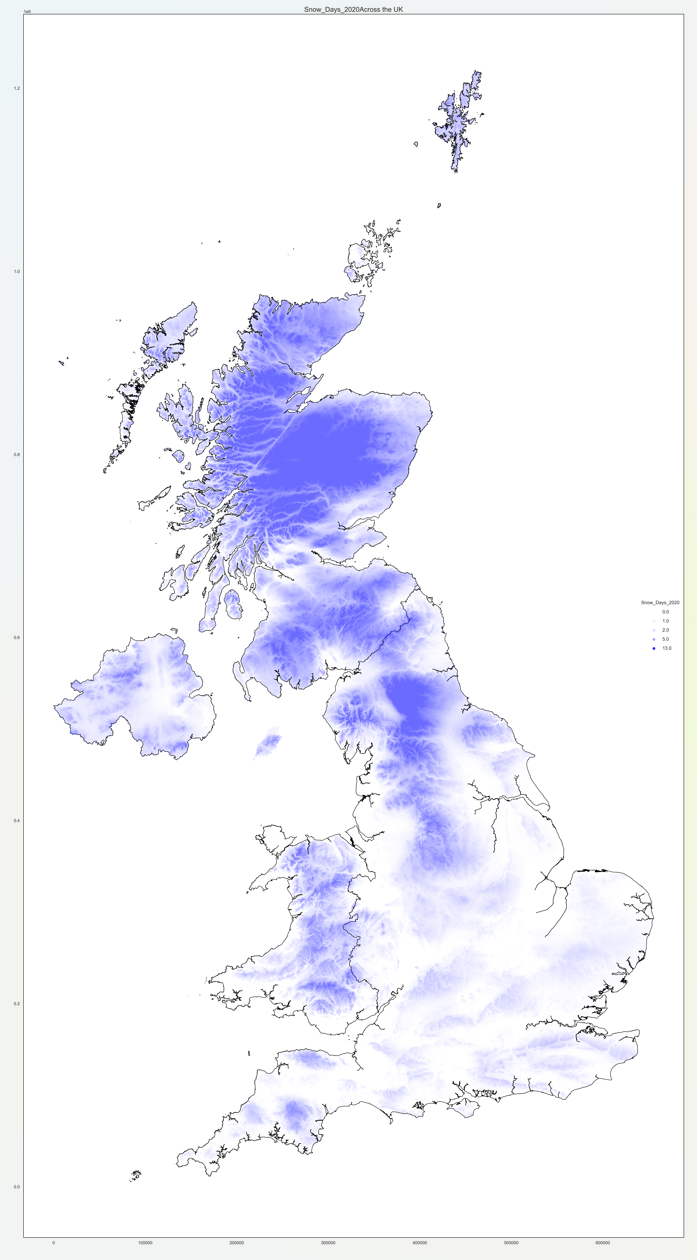
I recently discovered that the Met office publish historic HADUK datasets about historic weather patterns for the whole of the UK. They share a number of different types of weather data: Snow, rainfall, temperature…etc. at a lot of different scales: annual, seasonal, monthly, daily. I wanted to see what this data looks like in maps made in python.
I’ve focused on the annual data for a single year to avoid having to learn too much and get distracted down a different rabbit hole.
The first step was to import the data into a geopandas dataframe.
It’s published in NetCDF format which is capable of storing multidimensional data. By using just a single year of annual data I can just ignore the different dimensions. Here I’m importing rainfall, snow days, sunlight hours, average temperature and ground frost days and combining it into my large store of UK data from this repo.
#Met office data for 2020
met_data = {
    "rainfall":["MetOffice/rainfall_hadukgrid_uk_1km_ann_202001-202012.nc", "TotalRainfall_mm_2020"],
    "snowLying":["MetOffice/snowLying_hadukgrid_uk_1km_ann_202001-202012.nc", "Snow_Days_2020"],
    "sun":["MetOffice/sun_hadukgrid_uk_1km_ann_202001-202012.nc", "Sunlight_h_2020"],
    "tas":["MetOffice/tas_hadukgrid_uk_1km_ann_202001-202012.nc", "AverageTemperature_C_2020"],
    "groundfrost":["MetOffice/groundfrost_hadukgrid_uk_1km_ann_202001-202012.nc", "GroundFrost_Days_2020"]
    }

def import_met(path, col, name):
    pth = root_path +path
    dnc = xr.open_dataset(pth)
    df = dnc.to_dataframe()

    df = df.dropna().reset_index().loc[:, ["projection_y_coordinate", "projection_x_coordinate", col, "bnds"]]
    df = df.loc[df["bnds"]==0,:].drop(columns="bnds").reset_index(drop=True)
    df = df.rename(columns={col: "Details_Float"})
    df["Name"] = name
    df["Type"] = "MetOffice"

    #Convert to Geopandas dataframe
    x_points = df["projection_x_coordinate"].to_numpy()
    y_points = df["projection_y_coordinate"].to_numpy()

    gdf = gpd.GeoDataFrame(df.loc[:,["Details_Float", "Type", "Name"]], geometry=gpd.points_from_xy(x_points, y_points), crs=Main_CRS)

    return gdf

for k in met_data.keys():
    raw_gdf = gpd.GeoDataFrame(pd.concat( [raw_gdf, import_met(met_data[k][0], k, met_data[k][1])], ignore_index=True) )
This makes a geopandas dataframe of points, each 1km apart with a data value “Details_Float” for that type of weather. I can now use matplotlib to plot these different weather patterns for the whole of the UK.
for i in ['TotalRainfall_mm_2020', 'Sunlight_h_2020', 'AverageTemperature_C_2020', 'GroundFrost_Days_2020', 'Snow_Days_2020']:
    fig, ax = plt.subplots(1, figsize=(30,60))
    plt.title(str(i) + "Across the UK", fontsize='xx-large')
    gdf.loc[gdf["Type"]=="All_GB",:].plot(ax=ax, color='none', edgecolor='black', zorder=1)

    points = gdf.loc[(gdf["Type"]=="MetOffice") & (gdf["Name"]==i) & (gdf["Details_Float"].notna()),:].copy()

    cap = points["Details_Float"].quantile(0.99)
    points["Normalised"] = points["Details_Float"] / cap
    points["Normalised"] = points['Normalised'].where(points['Normalised'] <= 1, 1)

    points.plot(ax=ax, c="blue", markersize=1, alpha=points["Normalised"])

    legend_points = [round(points["Details_Float"].quantile(0.10),0), round(points["Details_Float"].quantile(0.30),0), round(points["Details_Float"].quantile(0.50),0), round(points["Details_Float"].quantile(0.70),0), round(points["Details_Float"].quantile(0.90),0)]

    for val in legend_points:
        plt.scatter([], [], c="blue", alpha=val/cap, label=str(val))
    plt.legend(scatterpoints=1, frameon=False, labelspacing=1, title=i, loc='center right', fontsize='large' )

    plt.savefig("D:/GeoData/WorkingData/Images/" + i +'.png',dpi=300)
    plt.close(fig)
The output pictures are huge because there are lots of points in the UK, it all gets a bit messy for smaller plots. The outputs look pretty nice. Below is a picture of UK snowfall

When you zoom in you can see all of the individual points from the data. In mountainous areas (like Wales) you can see the individual hills and valleys.

