In previous posts I’ve found the nearest neighbour and plotted Met Office data using geopandas in python. Now it’s time to to calculate and visualise spatial density. I’ll do this in a way that was conceptually easy for me to understand and then switch to using spatial indexes to speed things up significantly. The code for these
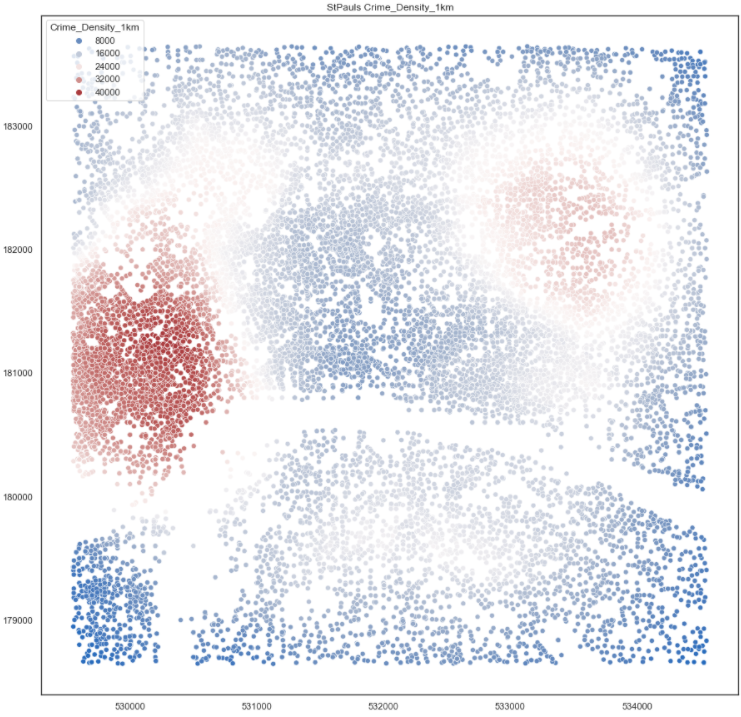
First, we need some points. This time we’re going to use two sets of points. Postcodes in a 5km square around St Paul’s Cathedral and Crimes in the same box. Postcodes are taken from the National Statistics Postcode Lookup (NSPL) file and the crimes are from 2020 reported crimes from the data.police.uk. More detail on the code and sources for importing and processing of this data is on my Github repo for this project. The maps below are made with matplotlib and seaborn.
Calculating density manually
To begin with I’ll be focusing on the postcodes as this process can be extrapolated to all point based datasets.
My initial process was to:
- choose a point
- draw a 1km radius circle around it
- intersect this circle with the original points
- count the intersected points
def count_points(df, point, radius):
    point_bf = point.geometry.buffer(radius)
    n = df["geometry"].intersection(point_bf)
    pointcount = len(df[~n.is_empty])
    return pointcount
As you can see, this is a lot of steps. All in python. and just to run it over a single point in the St Paul’s area took 1.4s. There are 34,071 postcodes in the 5km grid above and 1.4M in the UK. Running this that many times is unfeasible. There must be a better way!
Alternative option
Shapely has the “within” function. This does exactly what I want it to do (find the points within a polygon)
points.within(point.geometry.buffer(1000)).sum()0.1s for a single point. Much quicker. But when I ran it over the whole of the St Pauls postcodes I gave up after 10minutes of waiting. Again, there must be a better way. Then I remembered the nearest neighbour post. Spatial indexes (indices?) will make this quicker.
Spatial Index
def density_within_radius(df,points, radius):
    df_geom_col = df.geometry.name
    points_geom_col = points.geometry.name

    np_df = np.array(df[df_geom_col].apply(lambda geom: (geom.x, geom.y)).to_list())
    np_points = np.array(points[points_geom_col].apply(lambda geom: (geom.x, geom.y)).to_list())
    tree = BallTree(np_points, leaf_size=15)

    within_radius = tree.query_radius(np_df, r=radius, count_only=True)
    return within_radius
This took 1.4 seconds to run over all 34k points. This is definitely the winner. I then proceeded to calculate the number of postcodes within 1km of each postcode and the number of crimes within each 1km of each postcode and then finally divided one by the other to get a crime rate per postcode.


The aim of dividing the crime density by the postcode density was to use the postcodes as a proxy for population. To me, having 10 crimes where 100 people live is a lot worse than 1000 crimes where 100k people live. But the problem with using postcodes as a proxy for people is that Post Offices can have a lot of postcodes. And in the left and right maps you can see Mount Pleasant skewing the results somewhat.
KDE plots
An alternative to this method is using a kernel density plot. I tried this too
fig, ax = plt.subplots(1, figsize=(15,15))
plt.title(name + " postcode kde plot")
sns.kdeplot(x=Postcodes["geometry"].x, y=Postcodes["geometry"].y, shade=True, palette="vlag", data=Postcodes)
plt.show()
While this looks more interesting, I don’t think it’s as useful as it’s not storing data for future use.
Sklearn balltree does have a kde option that I’ll explore as that might give a usable output for future work.


