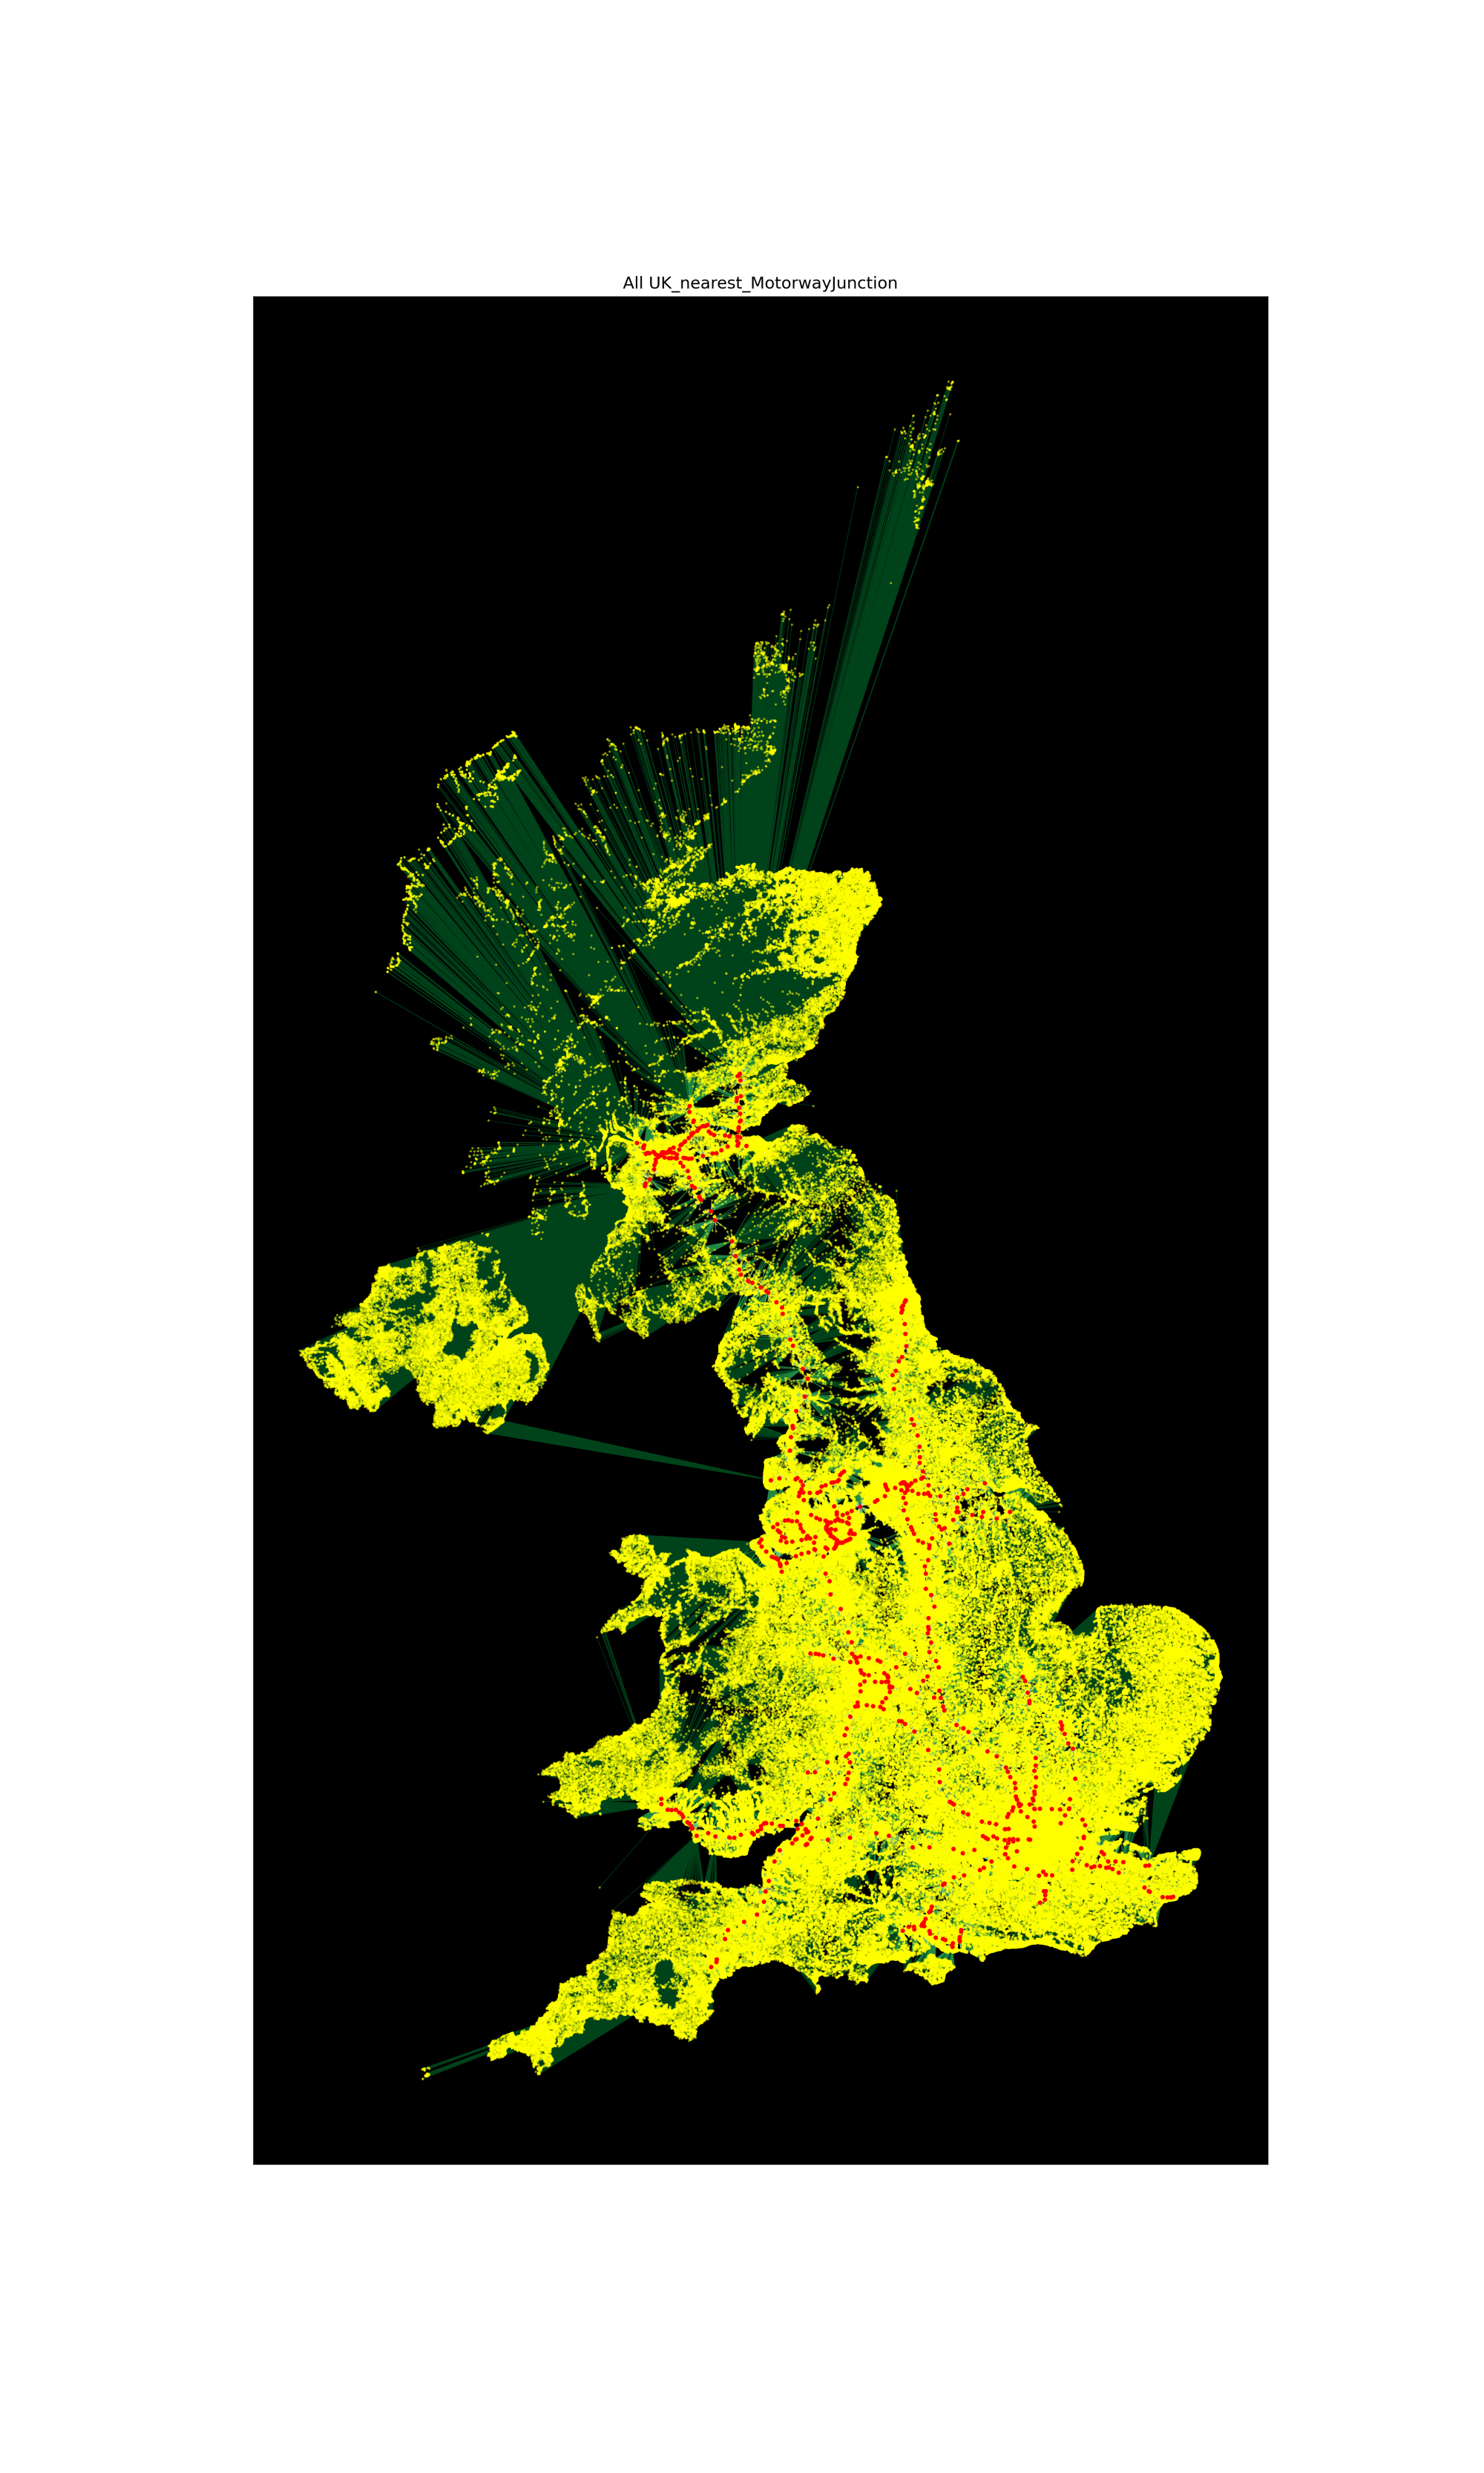
In a previous post I collected lots of different public data sources, imported them into python, made geopandas dataframes and made some simple maps. I now want to start some calculations. I’ve got some questions I want to answer. The first being
For any postcode in the UK, how far is it to the nearest train station?
This post heavily relies on this course from the University of Helsinki. The Jupyter notebook used for these calculations is saved on the project GitHub page here.
To keep my data small I’ve simplify the area I’m looking at to a 5km x 5km grid from around Euston.

The bulk of work is done using the BallTree function from sklearn within this function
def get_nearest(src_points, candidates, k_neighbors=1):
    """Find nearest neighbors for all source points from a set of candidate points"""

    # Create tree from the candidate points
     # removed metric since the default is euclidian (what my coordinates use)
    tree = BallTree(candidates, leaf_size=15)

    # Find closest points and distances
    distances, indices = tree.query(src_points, k=k_neighbors)

    # Transpose to get distances and indices into arrays
    distances = distances.transpose()
    indices = indices.transpose()

    # Get closest indices and distances (i.e. array at index 0)
    # note: for the second closest points, you would take index 1, etc.
    closest = indices[0]
    closest_dist = distances[0]

    # Return indices and distances
    return (closest, closest_dist)
This page explains this better but my explanation is: We set up a BallTree of all of the candidates (in our case train stations) and then it queries all of the src_points (postcodes) against this tree to find the distance from each candidate to src_point and puts them in order. We then select the closest one and extract the distance to it.
There is another function “nearest_neighbor” which prepares the data for the above function and then cleans the output ready for future analysis and plotting. But the get_nearest is doing the work.
I could just just leave it there and be done but I think we need a pretty picture first.
# Create a link (LineString) between building and stop points
Mapset['NSPL_gdf']['link'] = Mapset['NSPL_gdf'].apply(lambda row: LineString([row['geometry'], row['Nearest_TrainStation_Geometry']]), axis=1)

# Set link as the active geometry
Postcode_links = Mapset['NSPL_gdf'].copy()
Postcode_links = Postcode_links.set_geometry('link')

# Plot the connecting links between buildings and stops and color them based on distance
ax = Postcode_links.plot(column='Nearest_TrainStation_Distance', cmap='Greens', scheme='quantiles', k=4, alpha=0.8, lw=0.7, figsize=(13, 10))
ax = Mapset['NSPL_gdf'].plot(ax=ax, color='yellow', markersize=1, alpha=0.7)
ax = Mapset['RailwayStations'].plot(ax=ax, markersize=4, marker='o', color='red', alpha=0.9, zorder=3)

# Set map background color to black, which helps with contrast
ax.set_facecolor('black')

plt.savefig("Images/" + 'NearestNeighbour.png',dpi=300)
This draws a line between the postcode and the train station and then plots it with a picture that looks like fireworks

This picture very satisfying. It gets a bit dense in the Marylebone area (bottom left) but the rest looks like fireworks. And the fact that the areas look like they don’t overlap suggests that things are working as expected.
The cover picture for the post is the same process, but applied to the whole of Great Britain. Although this did require going back and re-importing NSPL data since GB used the OS National grid and NI the Irish grid and I didn’t realise. Because of the scale of that map the yellow dots dominate rather than the green stars.
Gallery contains some more of these firework charts


