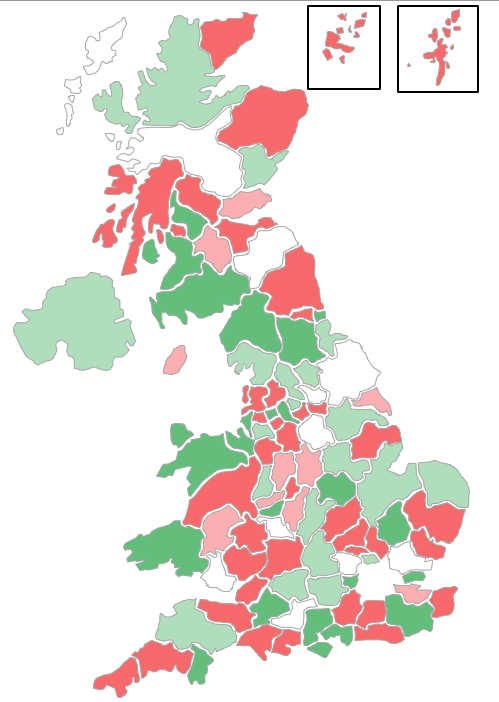
Excel isn’t the best tool for mapping data, but sometimes you want something quick and don’t want to learn new software. This post is about the Excel based UK postcode area map I made and is based on this post from ClearlyAndSimply.
The map is made up of a collection of hand drawn and named shaped of uk post code areas. Then I used a VBA macro to connect them together so they could have their colours changed based on different data.
The spreadsheet contains a number of features
- Data sheet
- Put in as many variables per postcode area as you want. As long as they are numeric, the process will work
- Add your variables, then click “Update variables”
- Put in as many variables per postcode area as you want. As long as they are numeric, the process will work
- Control sheet
- Add as many 10 level colour scales as you like. Add them to the right of the existing colours, or just change an exiting one. then click “Update colour list”
- Map Sheet
- Select your variable you want to map from the variable drop down list and the map will update automatically
- Hover your pointer over an area and a tooltip will pop up giving details on that areas
- Legend updates when you select your colour scale
- If you click on a shape, the data table updates
- You can select the variables you want for the data table
Download a copy of the spreadsheet here
Service Unavailable
The server is temporarily unable to service your request due to maintenance downtime or capacity problems. Please try again later.
Additionally, a 503 Service Unavailable error was encountered while trying to use an ErrorDocument to handle the request.
