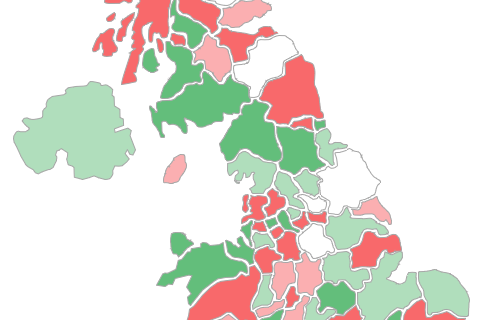
Quite a long time ago now I wrote a post on my map of UK postcode towns in Microsoft Excel based on various posts I had seen on clearandsimply.com. It turns out I do actually use this map quite a lot as it is very quick to use and doesn’t require any extra specialist software. So I thought I would revisit this. Read More
Tag: Excel

Plotting shapefiles in R
After my last post on the ONS data structure this post is the first of a few on using that structure and some other public data, mostly UK government data, and mapping it using R. This first post is about getting shapefiles from various locations, loading them into R and plotting them.

Changing a colour scheme and extracting data from the internet
Sometimes I have a spreadsheet containing lots of spreadsheets of similar formats all using the same colour scheme. And if after a while I decide I don’t like the colours any more then it can be quite annoying to change all of the colours. So I decided to write this short little macro to change the colours.
The Dog and the Duck
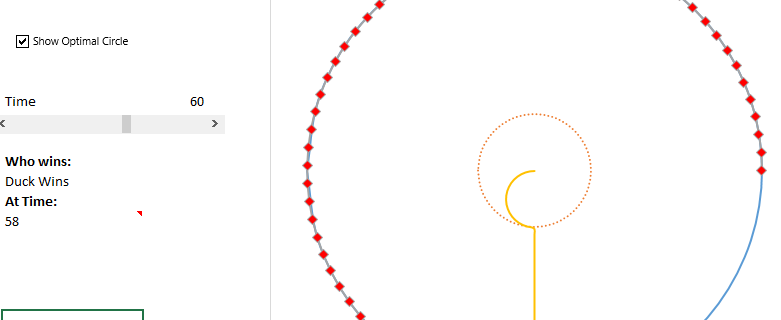
Time is of the essence with this post so please excuse the strange mix of notations later on. One of my friends sent me this puzzle from fivethirtyeight.com and here is my solution to how the dog needs to catch the duck.
Lots of peoples first instinct is times faster but this is really just a lower bound, i.e. if the dog travels less than π times faster than the duck then the duck can just read radially to the antipoint of the dogs starting position.
There are a few key assumptions here that we can make from the beginning:

Mapping UK Cities and Towns in Excel
Continuing my theme of recreating spreadsheets I’ve seen on Clearly and Simply I’ve had a go at making an Excel map of UK cities and towns that can be highlighted to find their combined population.

Further explorations into choropleth maps in Excel
I’ve been trying to improve my Excel choropleth map spreadsheet from my first post.
The first thing I tried was to try to update it using some maps created on ClearlyandSimply.com. So I’ve created two new versions, one for Europe and one of the World. Both using the maps from ClearlyandSimply.com, with a few small alterations to the code so that on hovering over the map it tells you the country not the abbreviation. I did try to make my own UK maps of Constituency boundaries and Counties but using this technique but no matter how hard I tried I couldn’t get it to work. If you do get it to work, please let me know. Note that in both the Europe and World map the data may not be accurate and is only there for illustrative purposes.
Pivot Chart Tracker

I was setting up some trackers at work the other day using some OLAP cubes in Excel across a number of different variables (about 20) to track monthly sales which I could refresh each month. Once I’d set the sales tracker up I realised that I wanted to look at average price across the same variables so I made a copy of the spreadsheet and went through each of the pivot tables changing them to track average price. When I then wanted to look at sales mix (%sales that month) I thought there must be a better way so decided to write some VBA to do all of this for me.
Read More
Mapping in Excel
Over the past year I've been having a play mapping things in Excel, not the best tool for doing this I know but it does the trick. Mapping the data directly from Excel has the advantage that I've my data is already in Excel. I would like to do the same exercise in R but that's for another day once I get to know R better.
The method I used is based on tips and methods used on Chandoo and Clear and Simply.
My output looks like this:
Which looks pretty good to me.
Read More